Guest Author, Fiona Yan

In today’s Data-centric AI world, improving data quality, finding data annotation mistakes, and quickly fixing errors are the most effective ways to improve model performance.
Better data quality is the answer to efficient model performance.
- With v0.5.5, image data can be visualized in vectorial distribution, which enables algorithm engineers a clear view of data deficiencies.
- Curating camera-LiDAR fusion data has always been challenging for AI researchers and engineers.
To analyze the LiDAR point cloud dataset, the AI team may start by loading LiDAR with various formats (.bin, .pcd, las, npz, etc.), configuring camera-LiDAR fusion data camera parameters, visualizing original data and with annotation results, comparing results of the same dataset among different human annotation teams and model’s results, and finding and fixing annotation mistakes.
Here are some of the new features that have been added:
Add Ontology Center
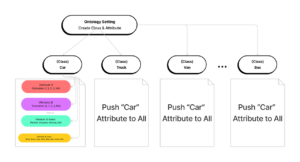
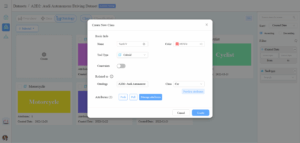
Now users can set up Ontology to add an entity’s class/attribute and manage template libraries. On the dataset’s Ontology page, all class/classification and settings can be synchronized with the global Ontology Center.
The improvements in user interface make the configuration simpler and more convenient than the previous version.
For example, in an autonomous driving dataset case, there are more than 10 classes, but their attributes are the same or similar. You can use this function to do the following:
Create a new class name and add attributes by choosing “Car” and then clicking on ‘Push’. All other classes can get the same attributes.
Add Data Visualization Feature
- Scenario Search in Ontology Center
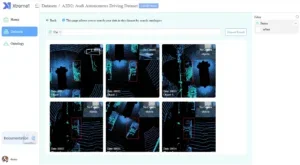
- Visually display data and annotation results on the Dataset page
- Search by class name to find the scene you are interested in
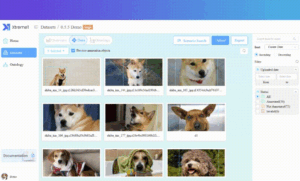
- Fix annotation errors and remove duplicate data by entering the annotation interface
- Available for LiDAR-camera fusion dataset
- The “Related To” function allows you to make associate or relationships with different entities
The function of associating entities can ensure better use of data through the relationship between entities.
When we have a large number of datasets, the naming of entities in each dataset is often inconsistent, but some express the same or similar meanings. For example, in an autonomous driving scenario with complex data, the standard “truck” label will be named “Truck”, but some data sets will be subdivided into “Pickup_Truck”, “Semi-Truck”, “Garbage_Truck”, etc. When searching for entities and results across data sets by the name of “Truck”, it is easy to lose existing data. To give another simple example, the entities of “dog” and “cat” may only need to be classified into one category as “Animal” in the dataset.
New Dataset Dashboard
Through the dashboard, the completion status and the number of labels of the statistics dataset annotation can be seen clearly.
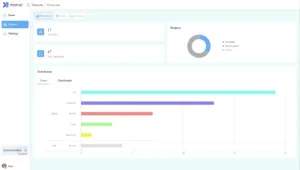
When data duplication is found, and the distribution of data types is uneven, it can quickly find the direction and continue to fill in the missing data types.
On the Data Similarity Map, points that are very close indicate that the similarity with nearby images is high. If it is limited, it demonstrates that this data type is insufficient or missing. If the model performance is not good, you can know which data needs to be collected and labeled accurately. Then, you can feed new data into the model again.
This process can improve the model’s performance by enhancing the data quality.
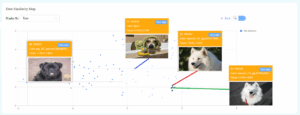
This function in Xtreme1 uses a pre-trained MobileNetV3 small model using the PyTorch framework, which converts images into vectors. Then openTSNE is applied to evaluate the effectiveness of the algorithm by compressing high-dimensional data into a 2-dimensional space for vector visualization.
API is Available
Xtreme1’s APIs can manage your datasets in Xtreme1, including uploading datasets and annotation, exporting results, and running model prediction, so that developers can integrate Xtreme1 with other products.
Reference:
[1] Searching for MobileNetV3: https://arxiv.org/abs/1905.02244
[2] openTSNE: https://github.com/pavlin-policar/openTSNE
[3] Visualizing data using t-SNE: Maaten L, Hinton G. Visualizing data using t-SNE[J]. Journal of machine learning research, 2008, 9(Nov): 2579–2605
[4] openTSNE: Extensible, parallel implementations of t-SNE: https://opentsne.readthedocs.io/en/latest/
Follow us and join our community
Visit and star our GitHub repo: https://github.com/xtreme1-io
Check out the Xtreme1 docs and website https://www.xtreme1.io/ for more information.
Join our Xtreme1’s Slack channel.
Xtreme1 Key Links
LF AI & Data Resources
- Learn about membership opportunities
- Explore the interactive landscape
- Check out our technical projects
- Join us at upcoming events
- Read the latest announcements on the blog
- Subscribe to the mailing lists
- Follow us on Twitter or Linkedin
- Access other resources on LF AI & Data’s GitHub or Wiki
